This page contains the GCSE AQA Mathematics Probability Questions and their answers for revision and understanding Probability .
Probability is the study of how likely things are to happen. We express probabilities either as fractions, decimals, or percentages, and they always fall between 0 and 1, where 0 represents total impossibility and 1 represents total certainty. For example, the probability of the result of coin flip being ‘heads’ is 0.5, 50%, 1/2. If we have an exhaustive list of outcomes (i.e. all possible outcomes are accounted for), then the sum of their probabilities must be 1. Continuing with the coin example, the only two possible outcomes are heads or tails, both of which have probability 0.5, and 0.5+0.5=1, as expected.
There are two types of probability you will see:
- Theoretical probability – this is the kind of probability that we have prior understanding of. For example, we know that the chance of rolling a 6 on a fair dice is 1/6.
- Relative frequency – this is the kind of probability that we determine from a survey or experiment. We calculate the relative frequency for a specific outcome as such:

For example, if you conducted a survey asking people what genres of music they enjoyed, then the relative frequency of people who liked rock music would be

We can use a probability value to determine expected frequency, which is the number of times we would expect an outcome to happen if were to do an experiment. It is calculated as such:
![]()
For example, if we roll a dice 60 times, the expected frequency of sixes is 1/6×60=10. In practice, it probably won’t end up being exactly ten times, i.e. our relative frequency won’t be 1/6. However, if you do more trials – 600 rolls, 6,000 times – the relative frequency will get closer to 1/6. In general, we say that the relative frequency will tend toward the theoretical probability as the number of trials increases. We say an experiment with more trials is more accurate.
Example: Stella and Gary are throwing darts at a target. By calculating relative frequencies, work out who is more likely to get a hit. Also, state which one of their relative frequencies gives a more accurate statement of their chance of hitting the target and explain why.

To calculate the relative frequencies, we will divide each person’s hits by their total attempts. Gary:
18/18+42=0.3
Then, Stella:
45/45+75=0.375
Therefore, Stella is more likely to get a hit. Furthermore, Stella made 45+75=120 attempts in total, compared to Gary’s 18+42=60, therefore Stella’s relative frequency is a more accurate representation of her chance of hitting the target than Gary’s is for him.
Often, we are interested in the probability of more than one event occurring. In this case, the events might be independent – the outcome of one does not affect the other – or dependent – the outcome of one does affect the other. In either case, we can use tree diagrams to solve these problems.
Example: Penny will play 2 games of badminton against Monica. Penny’s chances of winning each game are outlined in the tree diagram below, where P denotes a Penny win and M denotes a Monica win. Work out the probability of Penny winning exactly one match.
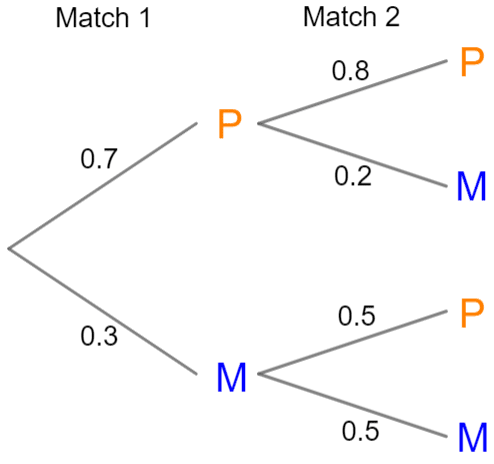
On a tree diagram, the first match is described by the left set of branches, and the second match is described by the right set of branches . As you can see, both outcomes of the first match then have their own pair of branches describing the outcomes of the second match – this way, all 4 possible outcomes of the 2 matches are included.
In this case, the 2 matches are dependent – if Penny wins the first match, then the chance of her winning the second is 0.8, but if she loses the first match, her chance of winning the second is 0.5.
To use a tree diagram, we have to introduce the and/or rule of probability. To understand this rule, imagine we have two events, A and B. To find the probability of A and B occurring, we multiply their probabilities, but to find the probability of A or B occurring, we add their probabilities. On a tree diagram, this means we multiply along the branches, and then add the resulting probabilities at the end.
So, we are looking for the probability that Penny wins exactly one match. This means she could either win the first and lose the second or lose the first and win the second. By multiplying along the P line for the first match and the M line for the second, we get
(P wins 1st, M wins 2nd)=0.7×0.2=0.14.
Similarly, by multiplying along the M line for the first match and the P line for the second, we get
P(M wins 1st, P wins 2nd)=0.3×0.5=0.15.
Either the first or second of these situations results in exactly one win for Penny, so to find the probability of one win for Penny, we add them:
P(Exactly 1 P win) =0.14+0.15=0.29.
If you are on the higher course, you also need to understand conditional probability – the chance of one thing happening given that you know something else has already happened. We use P(A|B) to denote “probability of A happening given B has happened”. In the case of a tree diagram, conditional probability works nicely – if we were to ask, “What is the probability that Monica wins the second match given that Penny has already won the first?”, all we need to do is look to the branch that represents the event of Monica winning the 2nd match after a Penny win. So, the probability of Monica winning the second given that Penny wins the first is 0.2. In other words,
P(Monica wins 2nd | Penny wins 1st)=0.2