This page contains the GCSE AQA Mathematics Straight Line Graphs Questions and their answers for revision and understanding Straight Line Graphs.
To be able to draw a straight line, you need to know some things about it. When asked to draw a straight line, you may be given either:
- A table of x, yx,y values/a list of a coordinates the line passes through, or
- The equation of the line, in the form y = mx + cy=mx+c.
To be honest, you’re rarely given a full table of values. What usually happens is that you’re given an equation and expected to use it to fill out a table of values, so we’ll go through that method instead, and then see how we could plot the same line straight from the equation.
Example: Below is an incomplete table of values for the line y = 2x – 3y=2x−3. Complete the table, plot the points, and use the points to draw the straight line.
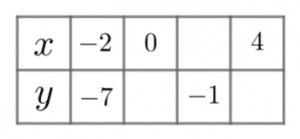
This table is essentially a collection of coordinates that the line passes through. So, we know that the line passes through (-2, -7)(−2,−7), but the other coordinates have either a missing xx or missing yy value. To work out the missing values, we use the equation like a formula, since the coordinates must satisfy the equation if the line is to pass through them. Substituting the values in the table in, we get the following.
When
x=0, we get y=2(0)−3=−3
x=4, we get y=2(4)−3=5
When y=−1, we get −1=2x−3
This last one gives us a linear equation to be solved. Adding 3 to both sides, we get
2=2x
Therefore, x=1. The completed table looks like
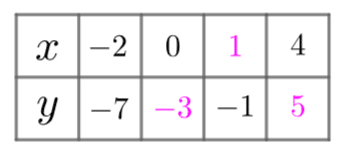
So, we know that the line passes through
(−2,−7),(0,−3),(1,−1), and (4,5)
Now all that remains is to plot them on a pair of axes and draw a straight line through them. The result should like the graph to the right.

An alternative method for plotting the straight line, as mentioned, is to do it straight from the equation. In the equation y=mx+c, mm is the gradient, and cc is the y-intercept. Thus, here the gradient must be 2 and the y-intercept must be -3.
So, we know that the line passes through(0,−3), and we know that because the gradient is 2, each time the xx value increases by 1, the y value increases by 2. This tells us that there must be another point 1 across and 2 up from (0,−3), meaning we can plot these two points, draw a straight line through them, and voila. This method is wordy to explain, but honestly once you practise it, you can get really quick at it
Sometimes the equations of straight lines aren’t given to you in the y = mx + c form, and you have to rearrange them in order to make this method doable.
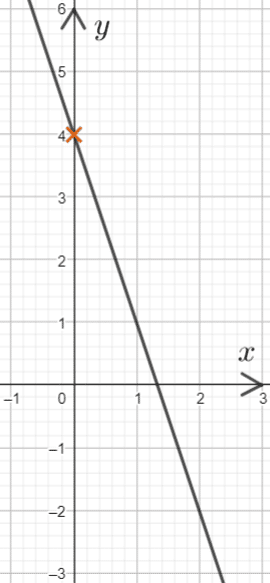
Example: Plot the straight-line graph with equation 3y+9x=12.
Firstly, subtract 6x from both sides so that the y term is on its own.
3y=−9x+12
Then, divide both sides by 3 to get
y=−3x+4
This is the desired form for a straight-line equation. Now we know that the yy-intercept is at (0,4), and the gradient is -3. Therefore, as the x value increases by 1, the y value decreases (due to negative gradient) by 3. Using this information, we should get a graph that looks a little like (well, exactly like) this: